 Achieved results? Now it's time for a review.
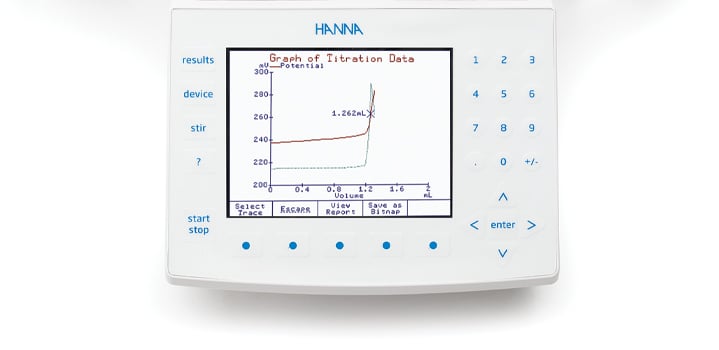
A smooth titration graph and receiving results back from your titrator does not always guarantee that they are accurate. Always review your results, your calculations, and quality checks.
Reviewing Results
#6 Know Your Specifications
It is important when reviewing titration results to ask yourself, “Does this result make sense?”. This is especially the case when switching methodologies, i.e. from manual titrations to automatic titrations. It can be alarming to see an unfamiliar number, but it is important to take a closer look at your specifications to determine the cause of deviation. The four most important parts of a specification to examine are the units, significant digits, the range, and the methodology used to originate the specifications. We will talk about the significance of each.


Calculation of Results:
There are many different ways to represent the results of titration. Units of specifications can vary, but specifications are commonly represented in %, ppm (mg/L or mg/g), or simply mL (milliliters) of titrant used to determine the endpoint. Results can be customized in the method options to match those of the specifications in more cases. Results that vary from the original specification by a common factor, like 10 or a 1000 are most commonly attributed to a difference in units and can be easily adjusted.
The other part of the unit is the analyte, or what specific chemical is being tested. In order to ensure that the results match the specification, it needs to be clear what form of the analyte is being represented.
In the example of a salt titration, some customers prefer that results be represented in sodium chloride, whereas some specifications represent the result in just chloride. The titration is exactly the same for both units, but the calculated results differ because of the difference in molar mass between sodium chloride and chloride. In the case of acidity, titration results are normally represented in units of the predominant acid. A specification that is written in % lactic acid, would differ greatly from a result represented in % citric acid. This is true, not only because of the differences in molar mass, but also the reaction ratio between the titrant and the specific acid. These deviations can easily be corrected in the method so that the results match the specification.
Range:
Usually, specifications are written as a range. For example, as discussed above, the sample should contain between 2.0% to 2.5% sodium chloride. Having a wide degree of tolerance in the range of a specification allows some leeway for time savings and sources of error. A very narrow specification range will require good lab technique and adherence to best practices to ensure that the results achieved are accurate. Specifications should be written with these limitations in mind, as well as being based upon the expected concentration of the analyte. The following are the AOAC guidelines for percent recovery and percent relative standard deviation (%RSD) based on the expected analyte concentration.

| Analyte Concentration | % Recovery | % RSD |
| 100% | 98 - 102 | 1.3 |
| 10% | 98 - 102 | 1.9 |
| 1% | 97 - 103 | 3.7 |
| 100 ppm (mg/kg; mg/L) | 95 - 105 | 5.3 |
| 10 ppm (mg/kg; mg/L) | 90 - 107 | 7.3 |
| 1 ppm (mg/kg; mg/L) | 80 - 110 | 11 |
| 100 ppb (μg/kg; μg/L) | 80 - 110 | 15 |
| 10 ppb (μg/kg; μg/L) | 60 - 115 | 21 |
| 1 ppb (μg/kg; μg/L) | 40 - 120 | 30 |
Methodology:
When possible, it is always a good idea to understand the methodology used to originate the specification. Different methods have varying degrees of accuracy and unique potential interferences. When moving from one methodology to another, i.e. from manual titration to automatic titration, there may be a slight difference in results. In the case of manual titrations, the endpoint is often overshot and the results can vary between operators. This leads to slightly higher numbers than the actual results. Specifications may need to be reevaluated when switching methodologies to improve the accuracy of the specification.
In summary, familiarity with specifications will make interpreting the results of titration much easier. Implementing quality checks, discussed below, will help to ensure that titration results are accurate.
#7 Implementing Quality Checks

Quality checks are typically used by labs to ensure the accuracy of their reported results. By implementing quality checks into your analysis procedure, you will not only have peace of mind but, you will also have documentation in case the results are called into question. There are several types of quality checks, but we will focus on blanks, laboratory control spikes, duplicates, and matrix spikes.
Blanks
A blank is a sample of your solvent that is carried through the sample preparation procedure and then titrated to ensure there is no interference or contamination from the analysis procedure. Remember that any titrant that is being dosed is being calculated into the results. Titrant that reacts with your solvent should not be included in sample results and can be factored out in the method options of the titrator.
Laboratory Control Spike (LCS)
A Laboratory Control Spike, abbreviated LCS, is a standard of known analyte concentration that is carried through the sample analysis procedure to evaluate the accuracy of the titration method. For example, if we were titrating the concentration of nickel in a plating bath, we would use a nickel standard of verified concentration to validate the accuracy of the testing procedure. The AOAC has published guidelines on percent recovery as it pertains to the concentration of analyte which is listed above. Laboratory Control Spikes can be used to validate new methods or to ensure the continued accuracy of current methods.
Duplicates
A duplicate is a sample that is carried through sample analysis as two independent samples to ensure that the results of the method are repeatable. Often when validating new methods, multiple replicates are analyzed to determine the relative standard deviation (RSD) between samples. The AOAC also has guidelines for %RSD as they pertain to the analyte concentration.
Sample Matrix Spike (MS)
A sample matrix spike, often abbreviated as MS, is a sample that is duplicated and to which a standard of known concentration is added to one of the replicates. Matrix spikes are useful in determining if the other components of your sample are interfering with the methods.
Note: Quality Checks are not limited to the titrator. Pipettes and balances can also be checked using reference material to ensure that they are maintaining their precision and accuracy. Quality checks can be performed as frequently as preferred, but are typically done at least daily or at the beginning of every shift.
Got Questions?
For more information regarding how Hanna Instruments can help you with your titration needs, contact us, at sales@hannainst.com or 1-800-426-6287.
Ready for Part 4?
OOPS! Did you happen to miss Part 2 - Analysis? Click Click HERE to read Part 2!
(Part 1 - Sample Preparation can be found HERE)