Color is everywhere in our daily lives. Did you know you can actually measure color? The spectrophotometer is an essential tool for biologists and technicians when analyzing chemical and biological samples.
This blog will look at some basics of spectrophotometry and the different configurations.
Light and Color
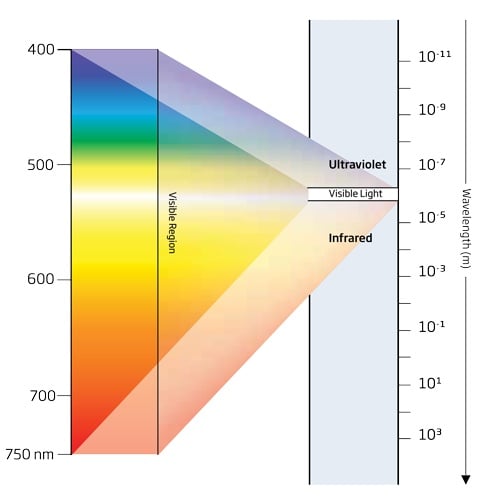
In simple terms, colors are dependent on light. We do not actually see colors rather, what we see as color is the effect of light shining on an object. When white light shines on an object, it may be reflected, absorbed, or transmitted. Glass transmits most of the light that comes into contact with it, thus it appears colorless. Snow reflects all of the light and appears white. A black cloth absorbs all light, and so appears black. A red piece of paper reflects red light better than it reflects other colors. Most objects appear colored because their chemical structure absorbs certain wavelengths of light and reflects others.
When discussing light, we are usually referring to white light. A thin line of light is called a ray; a beam is made up of many rays of light. When white light passes through a prism (a triangular transparent object) the colors that make up white light disperse into seven bands of color. These bands of color are called a spectrum. Seven colors constitute white light: red, orange, yellow, green, blue, indigo, and violet. In any spectrum, the bands of color are always organized in this order from left to right.
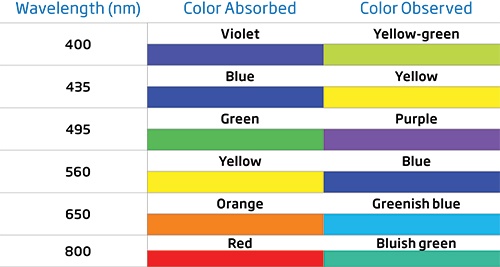
Suppose we shine a beam of white light at a substance that absorbs blue light. Since the blue component of the white light gets absorbed by the substance, the light that is transmitted is mostly yellow, the complementary color of blue. This yellow light reaches our eyes, and we “see” the substance as a yellow colored substance.
The color variation of a system that undergoes a change in concentration of some component is the basis of colorimetric analysis.
What is Colorimetery?
Colorimetry is simply the measurement of color. Colorimetry is the determination of the concentration of a substance by measurement of the relative absorption of light with respect to a known concentration of the substance. In visual colorimetry, natural or artificial white light is generally used as a light source and determinations are usually made with a simple instrument termed a colorimeter or color comparator. When the eye is replaced by a photoelectric cell, the instrument is termed a photoelectric colorimeter.
A colorimetric analysis is based on the principle that many substances react with each other and form a color which can indicate the concentration of the substance to be measured. When a substance is exposed to a beam of light intensity (I₀) a portion of the radiation is absorbed by the substance’s molecules and a radiation of intensity (I) is emitted. This difference in intensity is used for the colorimetric determination.
The quantity of radiation absorbed is given by the Beer-Lambert Law:
A = Ɛ · l · C
A is absorbance
Ɛ is the molar extinction coefficient [L/(mol·cm)]
l is path length (cm)
C is concentration (mol/liter)
Photometer vs Spectrophotometer
Photometer
A photometer isolates a specific wavelength of light by using filters. A colorimeter uses edge band filters, or some similar system, to separate light out into color components, and then fits those to matching curves based on the human eye, to produce color values based on what the human eye would see. This is ideal for matching the human visual response, but tells you nothing about data invisible to the human eye, such as emissive spikes at narrow points in the spectrum; that’s spectral data, and requires a spectrophotometer.

Spectrophotometer
Spectrophotometer are different from photometers as they allow for measurement in the spectrum of all wavelengths of visible light and not just pre-specified wavelengths. Spectrophotometers work by isolating light at specific wavelengths from white light. A spectrophotometer breaks light up into a spectrum, using a color grating or similar system. Then an array of sensors reads each section of the spectrum, producing spectral data. This is ideal if you are analyzing the spectral emissions of a lightbulb, a star, or some other light source, which is why spectrophotometers are often used as scientific devices.
Optical Configurations of a Spectrophotometer
Single Beam
In a conventional single-beam spectrophotometer, the blank and the sample are measured consecutively, with an interval of several seconds for a single wavelength measurement and up to several minutes for a full spectrum measurement with a conventional instrument. Lamp drift can result in significant errors over long time intervals.

Double Beam
The double, or dual-beam, spectrophotometer was developed to compensate for these changes in lamp intensity between measurements on blank and sample cuvettes. In this configuration, the light source emits a single light beam which is is split by a light chopper, creating two beams of equal energy with equal optical path. One beam passes through the reference while the other beam passes through the sample.
Compared with single-beam designs, dual-beam instruments contain more optical components, which reduces throughput and sensitivity. For high sensitivity, long measurement times may be required. In addition, the more complex mechanical design of the dual-beam spectrophotometer may result in poorer reliability.
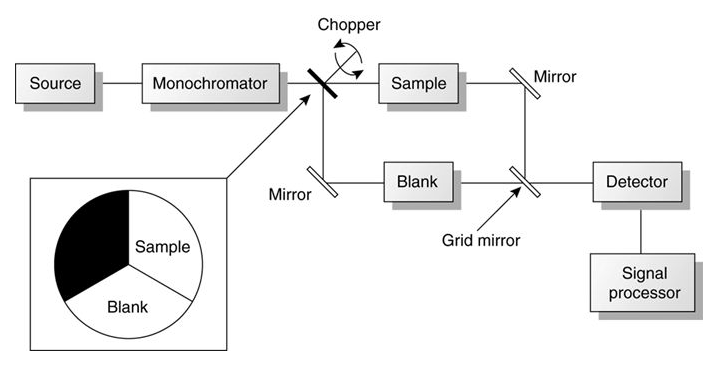
Split Beam
The split-beam spectrophotometer resembles the dual-beam spectrophotometer but uses a beam splitter instead of a chopper to send light long the blank and sample paths simultaneously to two separate but identical detectors. This configuration enables the blank and the sample to be measured at the same time. The split-beam design is mechanically simpler than the true dual-beam instrument and requires fewer optical elements.
Best Uses for a Spectrophotometer
Today’s spectrophotometers are designed to be both durable and portable, offering flexibility in use. While the applications are nearly endless, some of the best uses include:
- Elemental determination for water quality
- Enzymatic analysis in wine
- Analysis of fertilizer properties for agriculture
These are just some of the many potential uses for a spectrophotometer.


